Monitoring your website’s performance and visitor behavior is essential for understanding how your site is being used and identifying areas for improvement. With cPanel, you have access to a variety of tools that make it easy to track website statistics, such as traffic volume, visitor locations, viewed pages, and more. This guide walks you through how to access and interpret these statistics to help optimize your website and tailor content to your audience’s needs.
1. Log in to cPanel
-
Open your web browser and navigate to your cPanel login page (e.g., https://yourdomain.com/cpanel).
-
Enter your username and password.
-
Click Log in.
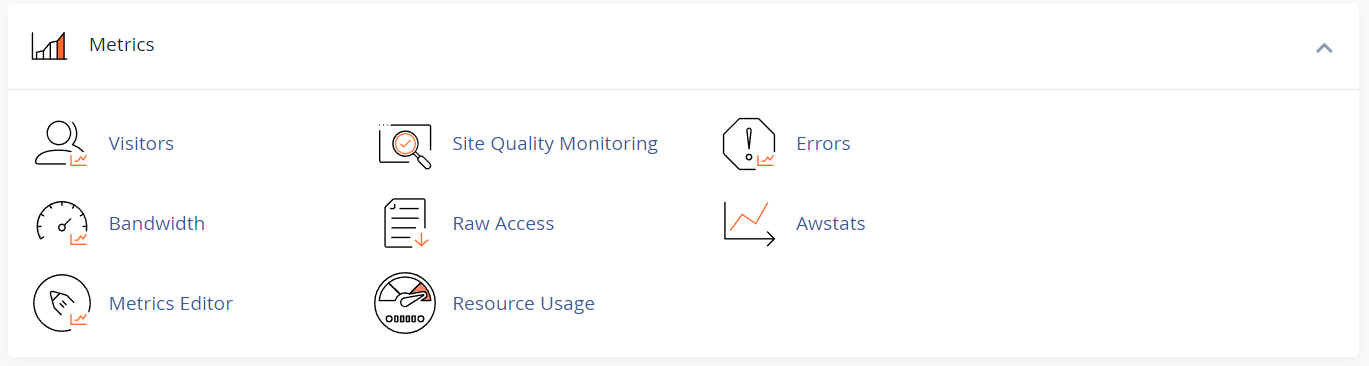
2. Locate the Metrics Section
Once inside the cPanel dashboard:
-
Scroll down to the Metrics section.
-
You’ll find a range of tools for tracking website activity, including:
-
Visitors
-
Awstats
-
Raw Access
-
Bandwidth
-
Errors
-
3. Using the Visitors Tool
The Visitors tool provides real-time insights into who is accessing your website.
-
Click Visitors under the Metrics section.
-
A list of recent visitors will be displayed, including:
-
IP address
-
Time of visit
-
Pages visited
-
Referrer (site or link they came from)
-
This tool is great for a quick overview of live visitor activity.
4. Analyzing Data with Awstats
Awstats is a more comprehensive analytics tool for reviewing long-term traffic trends and patterns.
-
Click Awstats under the Metrics section.
-
Select the domain you want to analyze.
You’ll see detailed stats such as:
-
Monthly and daily visitor counts
-
Unique visitors
-
Number of visits and pages viewed
-
Traffic sources (e.g., countries, search engines, external links)
-
Browser and operating system breakdown
-
Search keywords used to find your site
Awstats offers both summary and detailed reports, making it ideal for in-depth analysis.
5. Viewing Bandwidth Usage
Monitoring bandwidth usage is crucial if your hosting plan has limits.
-
Click Bandwidth in the Metrics section.
-
View bandwidth data broken down by service type:
-
HTTP (website traffic)
-
POP3/IMAP (email)
-
FTP (file transfers)
-
The graph and data help ensure you're not exceeding your limits, which could affect performance or cause downtime.
6. Accessing Logs via Raw Access
If you prefer working with unprocessed log data:
-
Click Raw Access in the Metrics section.
-
Download a compressed file containing your site’s access logs.
-
Open the file with a text editor or log analysis tool to view detailed traffic records.
This tool is especially helpful for developers or advanced users who need granular data.
7. Monitoring the Error Log
Use the Errors tool to identify and troubleshoot problems that visitors encounter.
-
Click Errors under the Metrics section.
-
View a list of recent error messages, such as:
-
404 (Page Not Found)
-
403 (Forbidden)
-
Server or script errors
-
Reviewing these logs helps you quickly find broken links, missing files, or misconfigured scripts.


